
RESULTS
Graphs of performance, comparing ONERX (ONE ROCK Fund) with common benchmarks.
GROWTH OF $10,000

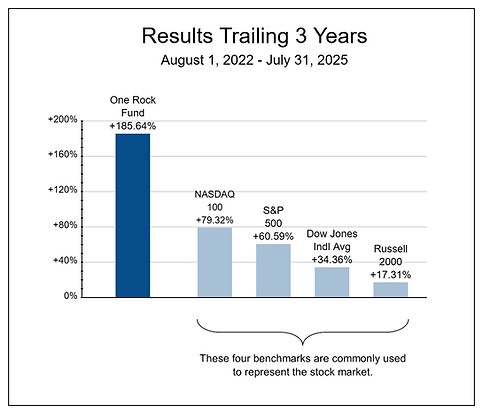
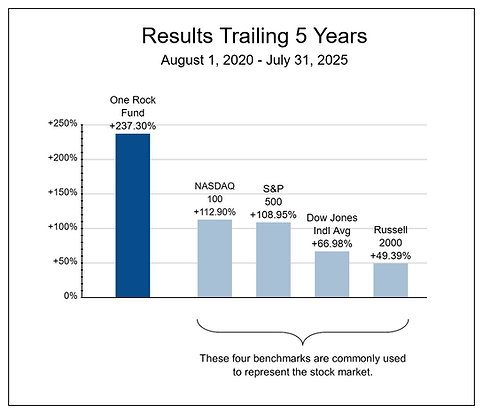
PERFORMANCE BAR CHARTS

HISTORY
Although short-term performance is often emphasized, a long history of strong performance is what drives wealth and the benefit of compounded returns.
OTHER RESULTS


QUARTERLY PERFORMANCE
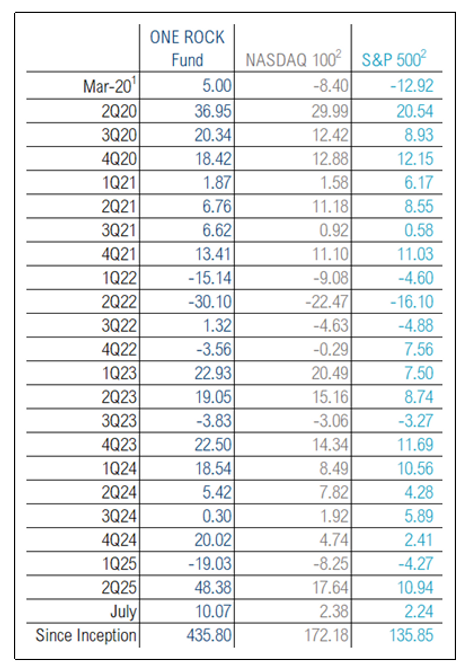
1. One Rock Fund's inception is March 6, 2020. Performance for “Mar-20" or "March 2020” is from March 6 – March 31, 2020, for One Rock Fund, NASDAQ 100 and S&P 500. Performance for "2020" is from March 6 - December 31, 2020. The Growth of $10,000 chart assumes the Fund’s inception date of 3/6/2020 for the indices. The returns shown do not reflect the deduction of taxes that a shareholder would pay on Fund distributions or on the redemption of Fund shares. Because of ongoing market volatility, Fund performance may be subject to substantial short-term changes. Data for indices from Yahoo Finance.
2. NASDAQ 100 is a stock index which includes 100 of the largest domestic and international non-financial companies listed on the Nasdaq Stock Market based on a modified capitalization-weighted index. The S&P 500 is a stock index that measures the performance of 500 large companies based on market capitalization listed on stock exchanges in the United States. The Dow Jones Industrial Average is a price-weighted measurement stock index of 30 prominent companies listed on stock exchanges in the United States. The Russell 2000 Index is an unmanaged market capitalization-weighted index of 2,000 small company stocks of U.S. domiciled companies.
There is no guarantee of future results.
Performance is historical and does not guarantee future results. Investment return and principle value will fluctuate with changing market conditions so that when redeemed, shares may be worth more or less than their original cost. Current performance may be lower or higher than the data quoted.